Debugging with Eclipse and gdb

Connecting to the target
First a connection to the TQ-Module has to be established with the Remote System Explorer. A step-by-step instruction is on this wiki page:
Connecting to the TQ-Module with the Remote System Explorer.
Configuration Eclipse gdb
Conditions:
- running demo application
- debugging works on the command line
- Open the configuration window in the menu
Run > Debug Configurations….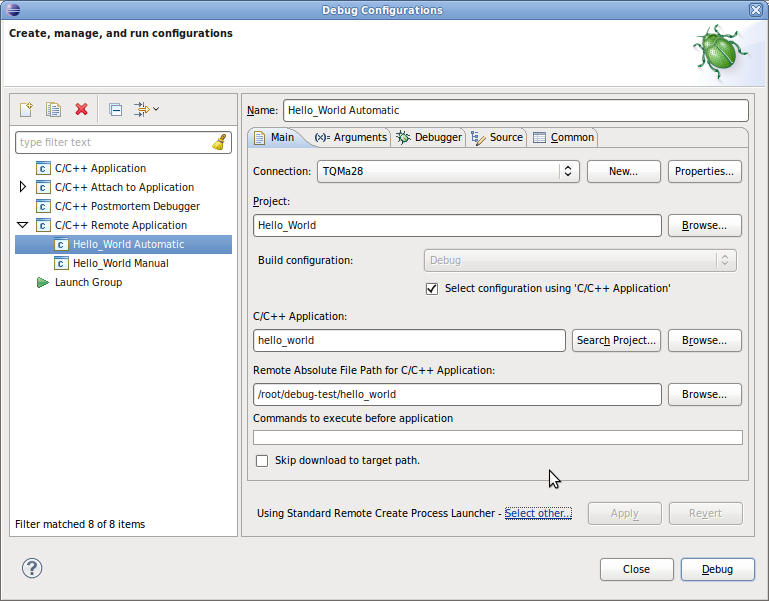
- Create a new
C/C++ Remote Applicationconfiguration there. - First select at the bottom
Select otheras launcher. In the appearing window checkUse configuration specific settingsand then select theStandard Remote Create Process Launcher. - Then select the previously created connection as connection in the tab
Main. - The
Remote Absolute File Path for C/C++ Applicationhas to be set (preferably via the buttonBrowse…. - The project- and application settings should be set correctly.
- Additional parameters can be passed to the program to be debugged in the tab
arguments. - The GDB debugger has to be set to the right GDB, in our case
arm-linux-gdb, in the tabmainof theDebugger Optionsin the tabDebugger.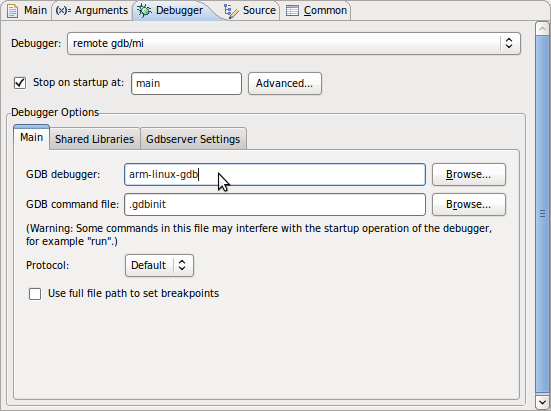
- The path to the
Shared Librarieson the host system has to be added in theDebugger Optionsfor the module. In this case/opt/eldk/arm/lib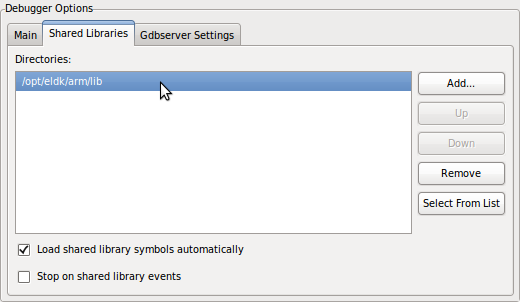
- Nothing has to be set in the tab
Gdbserver Settings.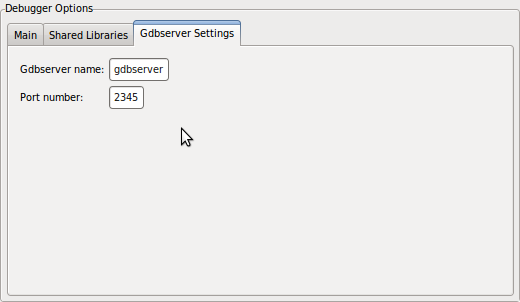
- Save the settings with
Applyand start debugging withDebug.

Troubleshooting
No source available
When you start the debug process, the source code is not displayed. Instead, an error message appears. “No source available for main() ”
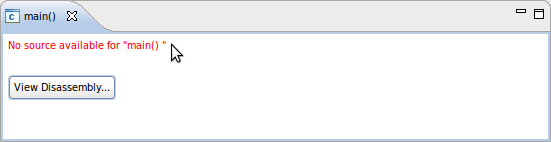
Reason: Debug symbols are not compiled in.
Correction: Activate the debug symbols in the variable CPPFLAGS with the switch -g in the make file:
CPPFLAGS := -Wall -g